Altcoins
Kaspa crypto jumps 28%: will it reach $0.2 this week?

- KAS price jumped 66% last month.
- The altcoin is preparing to return to its all-time high.
Proof of Work (PoW) Cryptocurrency Kaspa [KAS] is on the verge of regaining its all-time high of $0.18, after its rally above the long-term resistance level formed at $0.14.
KAS price moved in a range between April 12 and June 2, leading to the formation of a horizontal channel.
This channel forms when the price of an asset consolidates in a range, because a balance between buying and selling pressure prevents the price from moving sharply in one direction or the other.
The upper line of this channel forms resistance, while the lower line represents support. KAS faced resistance at the $0.14 price level, while it found support at $0.1.
Kaspa crypto recovers towards its all-time high
Since the beginning of June, KAS has seen an increase in trading volume. For example, on June 3, the altcoin’s daily trading volume stood at $165 million, marking its highest level since November 2023, according to Santiment data.
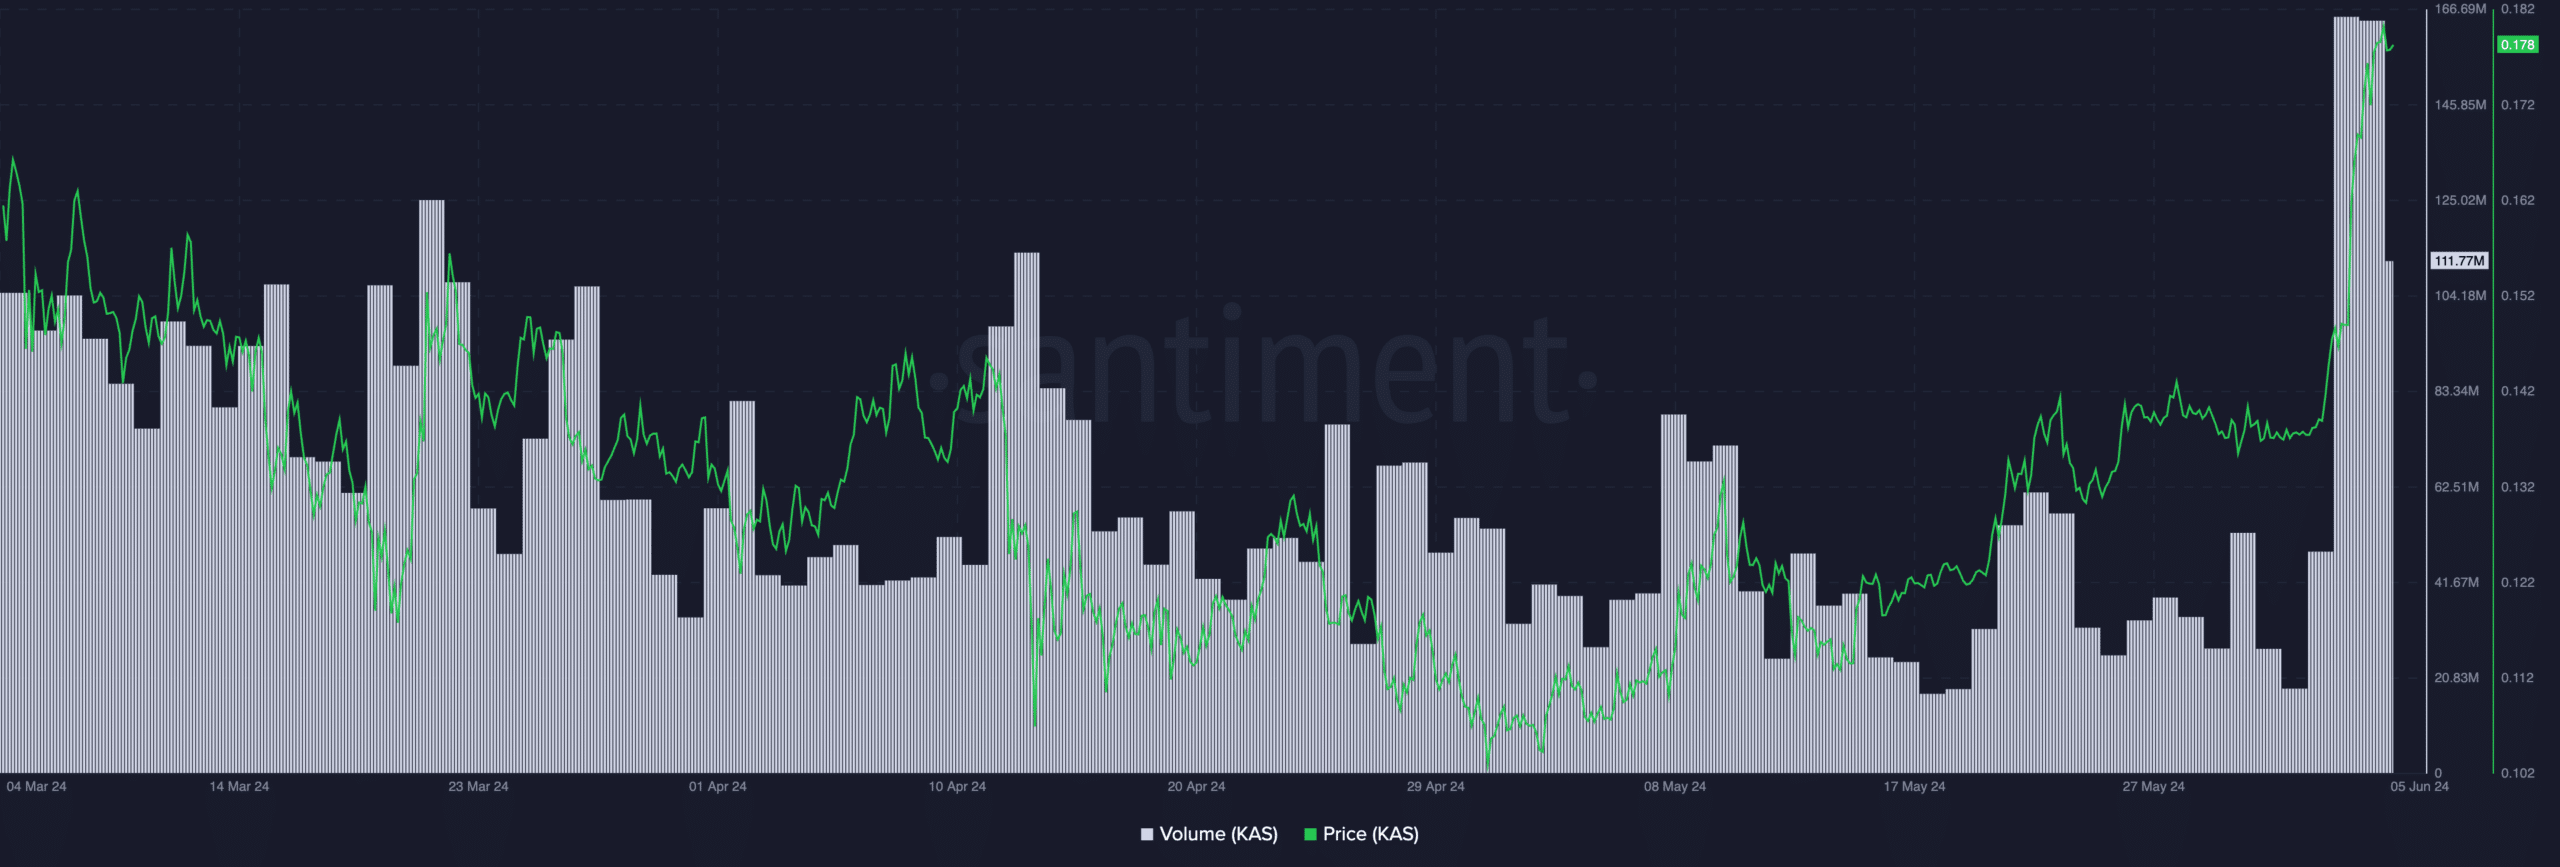
Source: Santiment
This surge in trading activity pushed KAS price above the upper line of its horizontal channel on June 3, indicating that it closed above resistance that day.
Trading at $0.1797 at press time, KAS price has continued its upward trend and is heading towards its all-time high of $0.18, recorded on February 20.
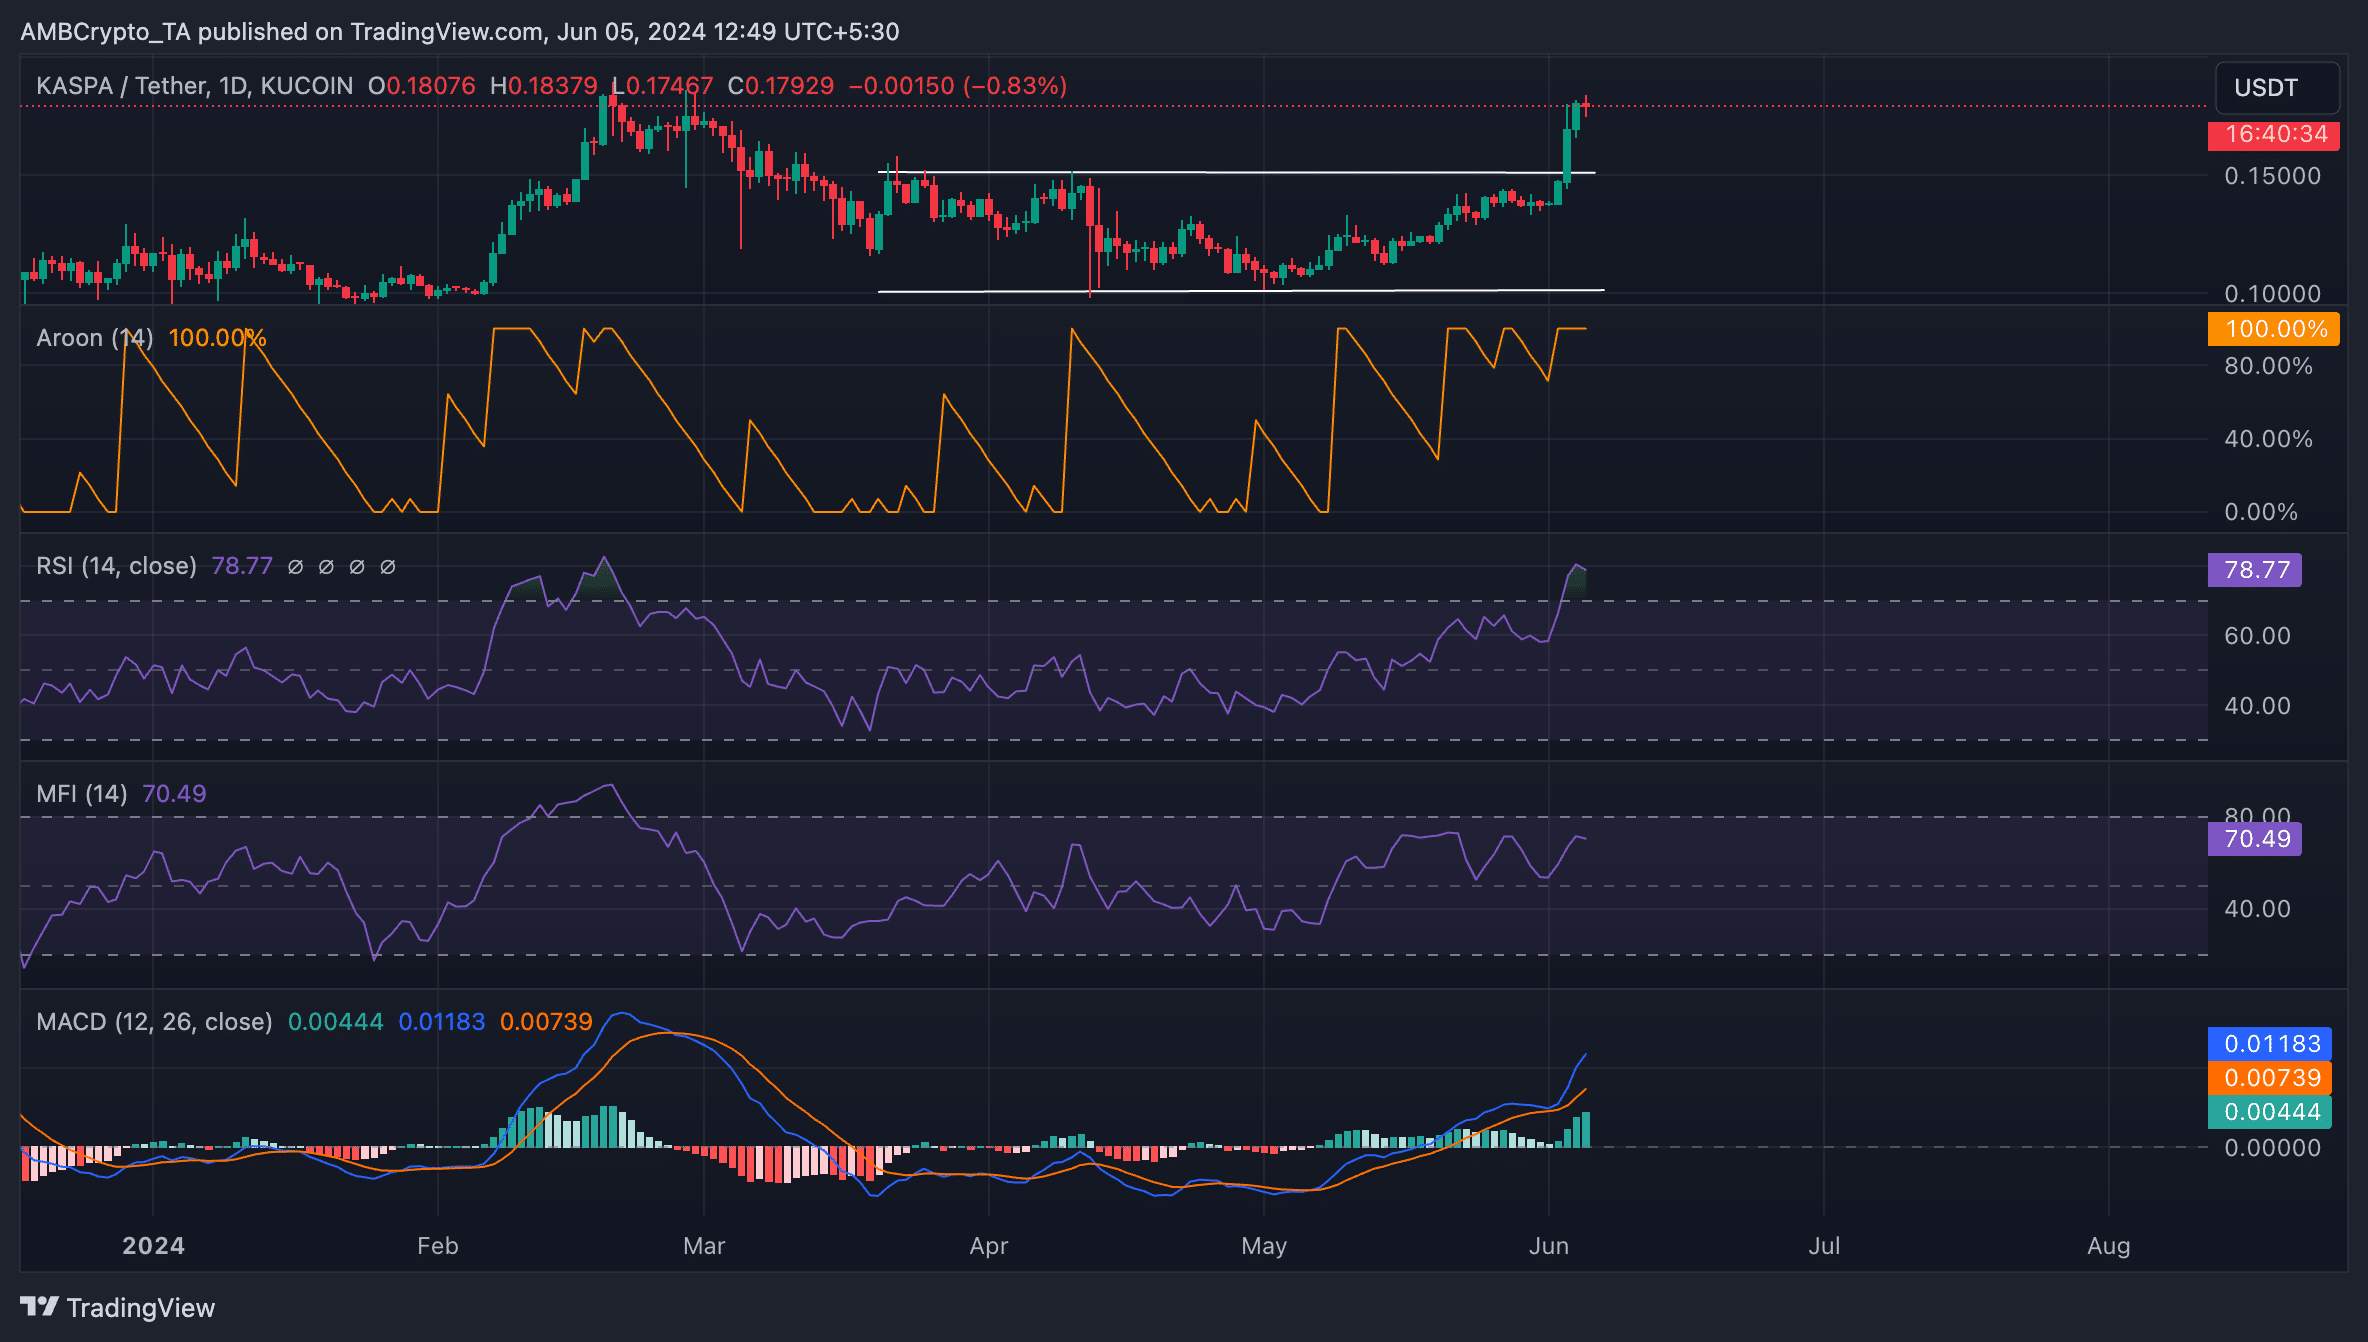
Source: KAS/USDT on TRadingView
Readings of its price movements on a daily chart suggest that it may continue its uptrend. For example, her Aroon Up (orange) line was 100% at the time of publication.
This indicator identifies the strength of an asset’s price trend and its potential reversal points.
When the Aroon Up line is near 100, it indicates that the uptrend is strong and the most recent high was reached relatively recently. This is a bullish signal.
The relative strength index (RSI) and money flow index (MFI) of the altcoin were 79.91 and 70.44, respectively, confirming the sharp rise in demand. These indicators showed that KAS’s buying momentum was greater than its selling pressure.
Additionally, KAS’s MACD line (blue) was above its signal line (orange) at the time of writing. When these lines are positioned this way, it is a bullish signal. This suggests that an asset’s short-term average is higher than its long-term average.
Read Kaspa [KAS] Price prediction 2024-25
Traders interpret it as a sign to open long positions and exit short positions.
If KAS’s buying momentum continues, its price could surpass its all-time high to trade at $0.2.
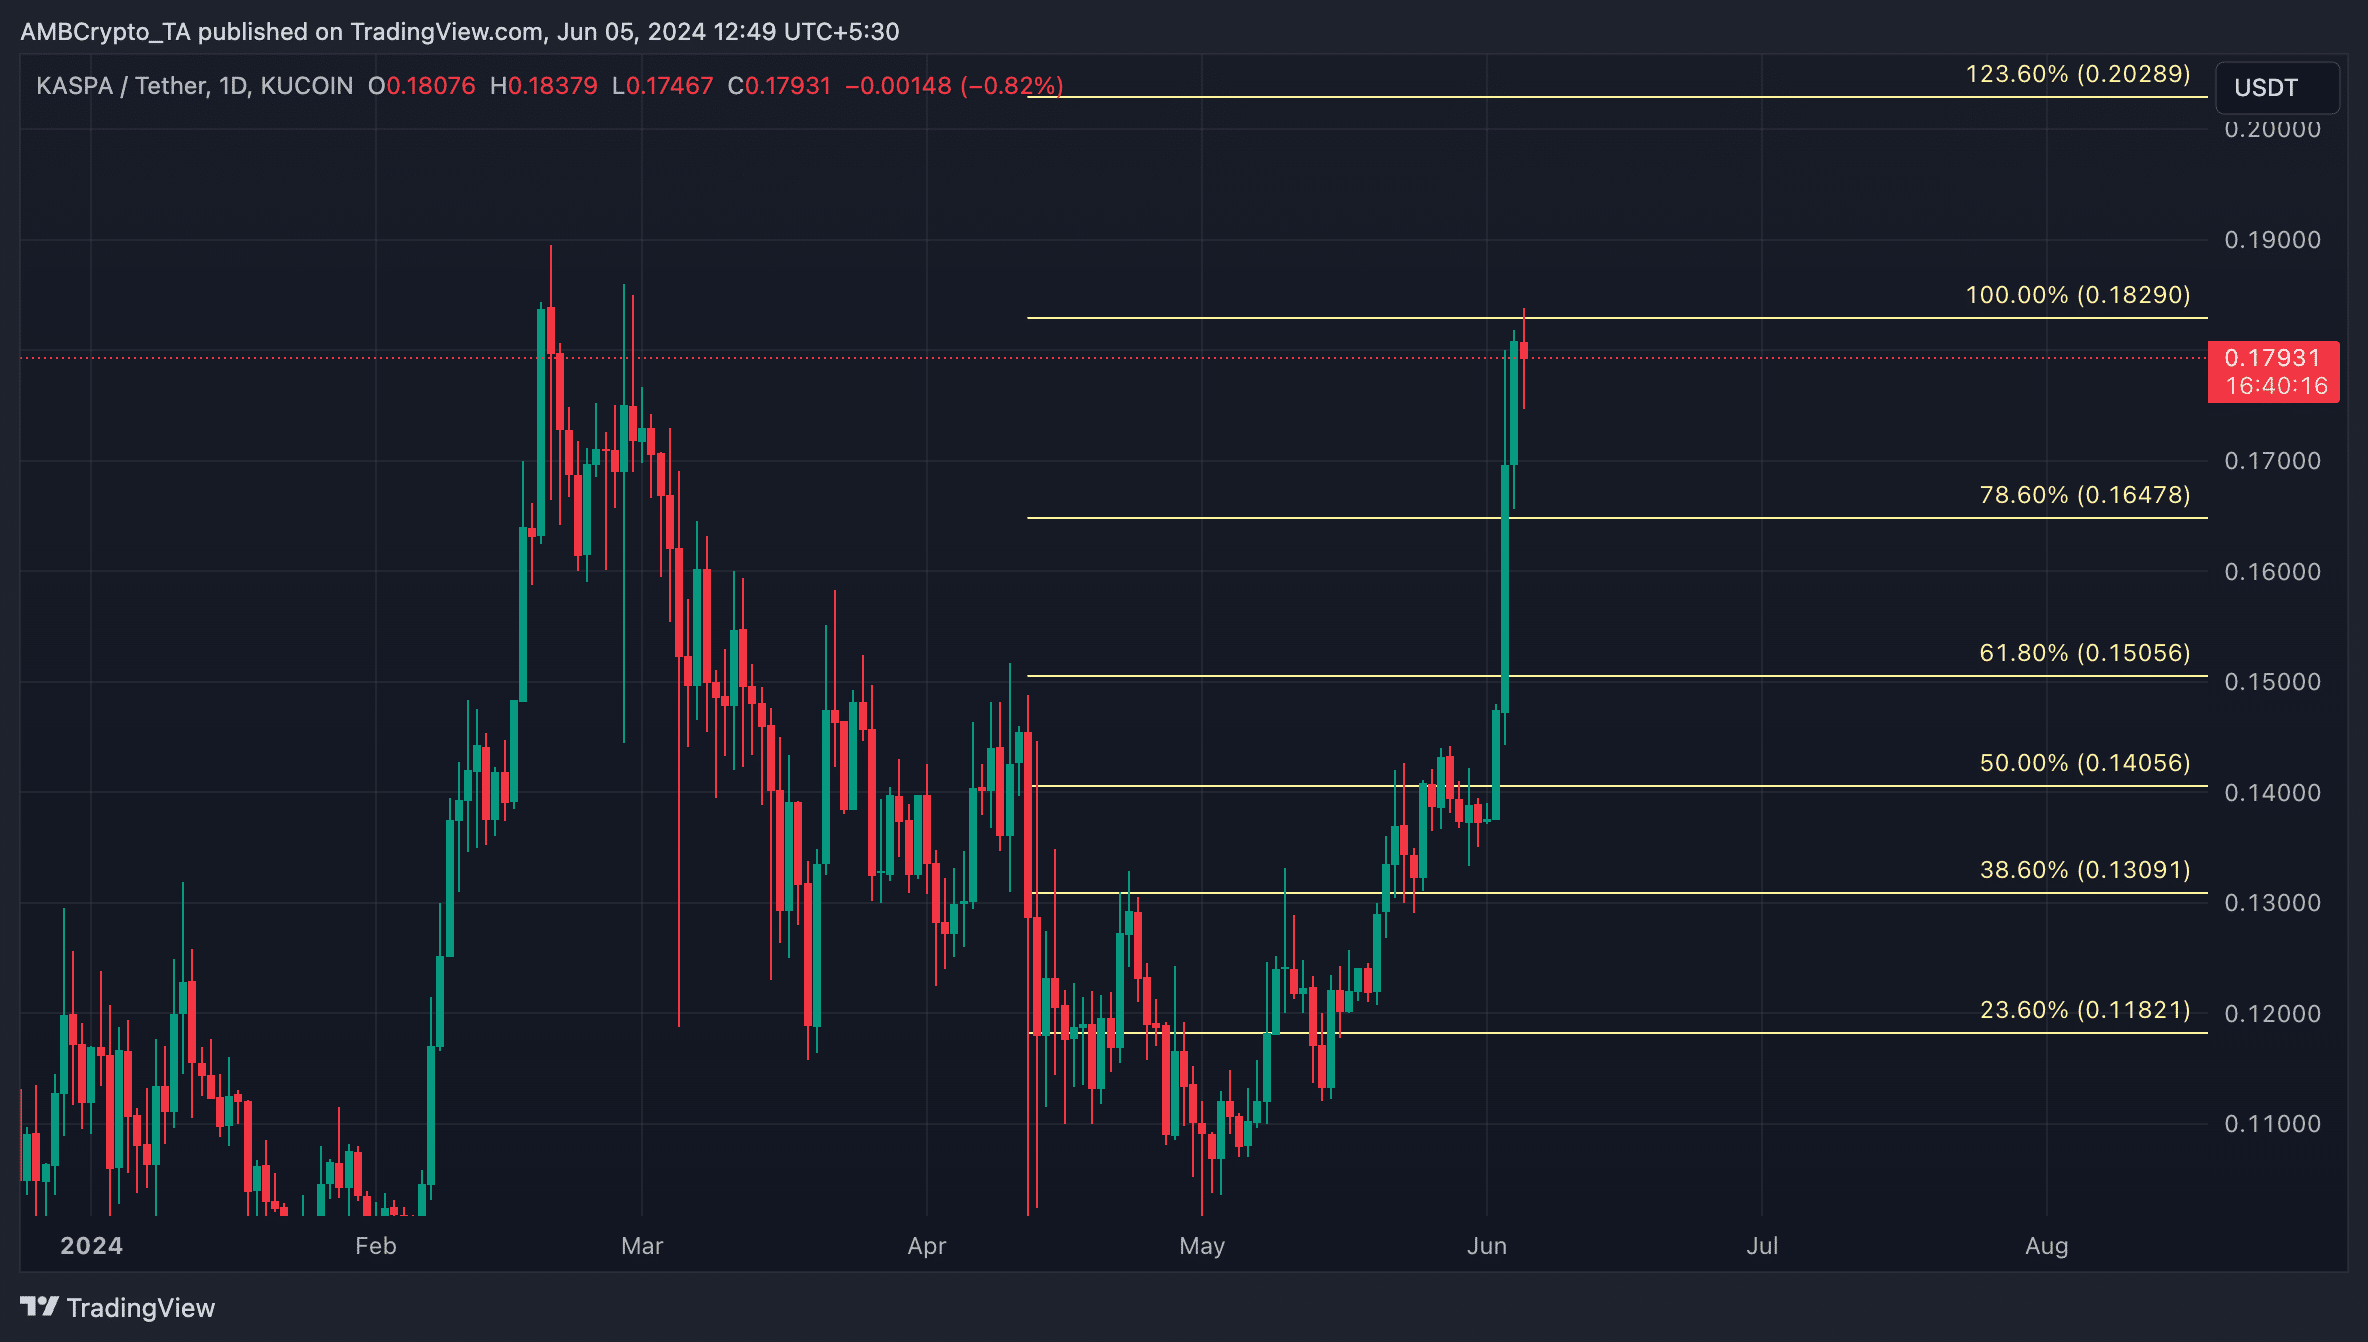
Source: KAS/USDT on TRadingView